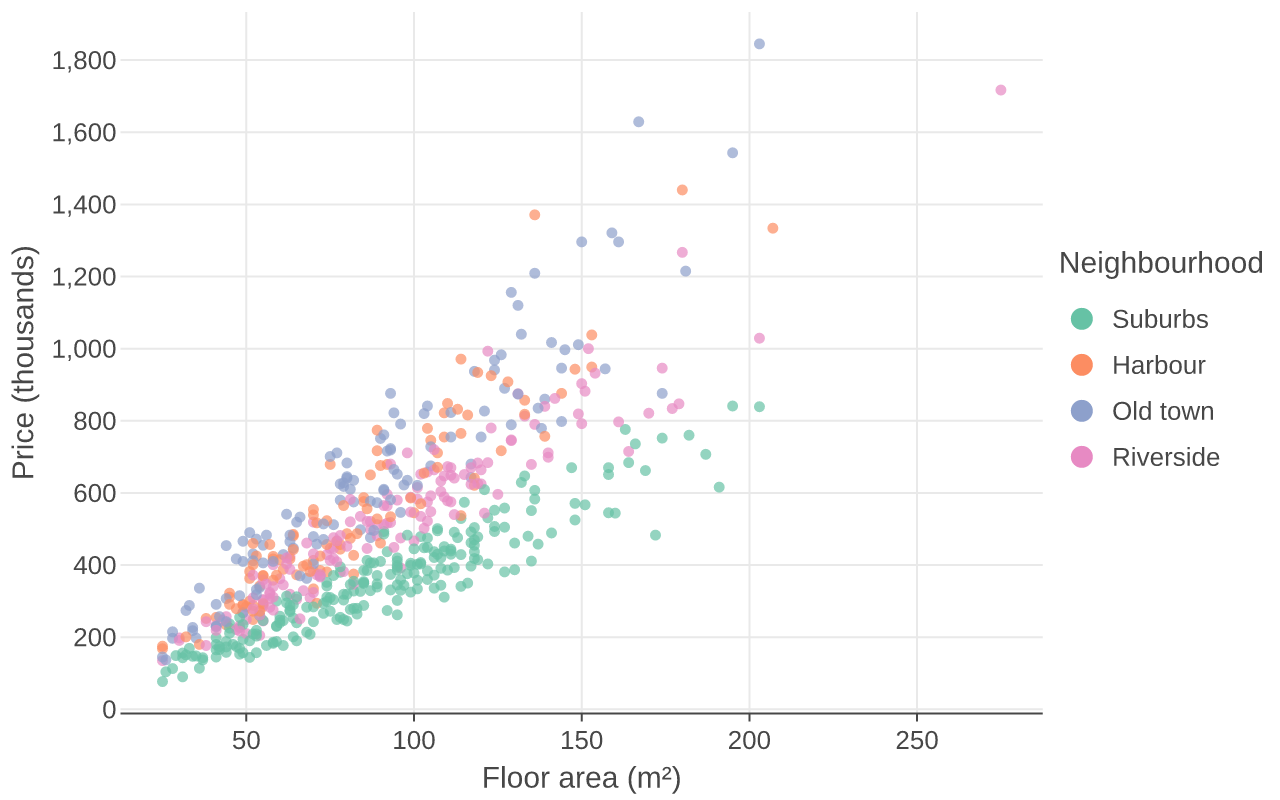
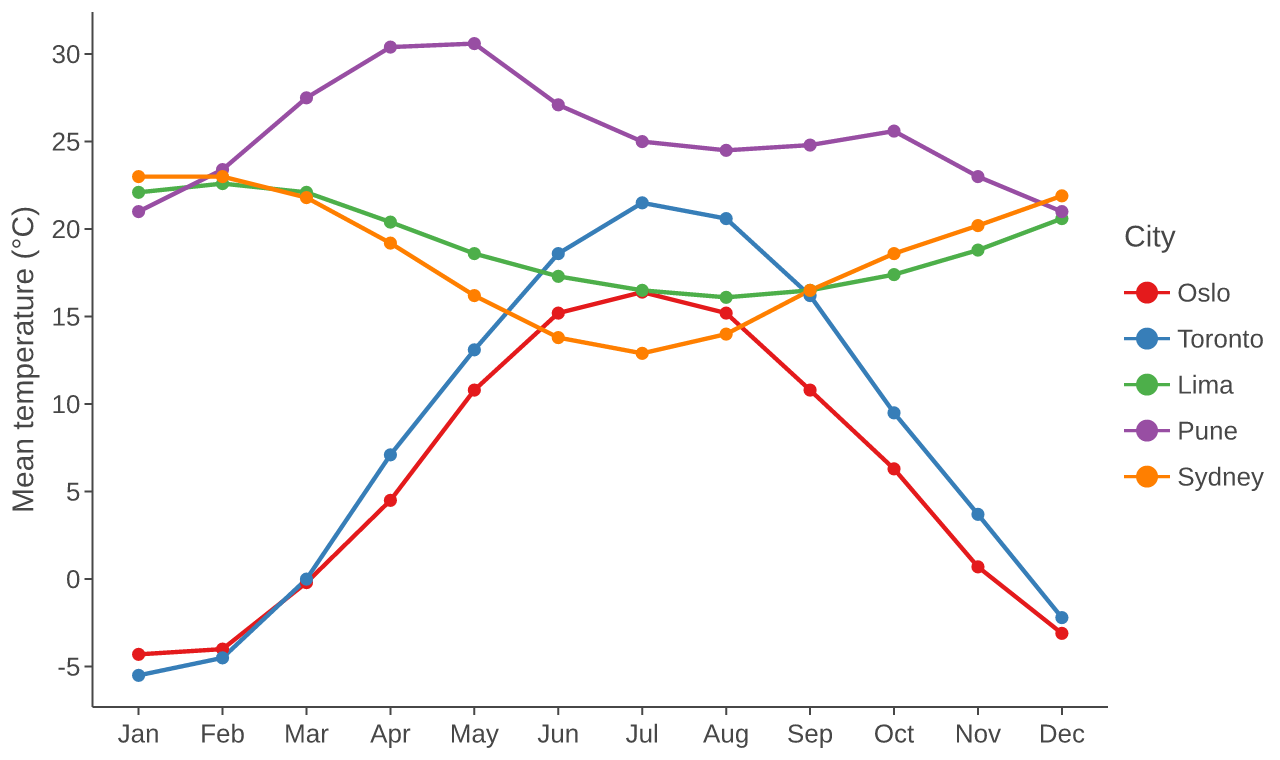
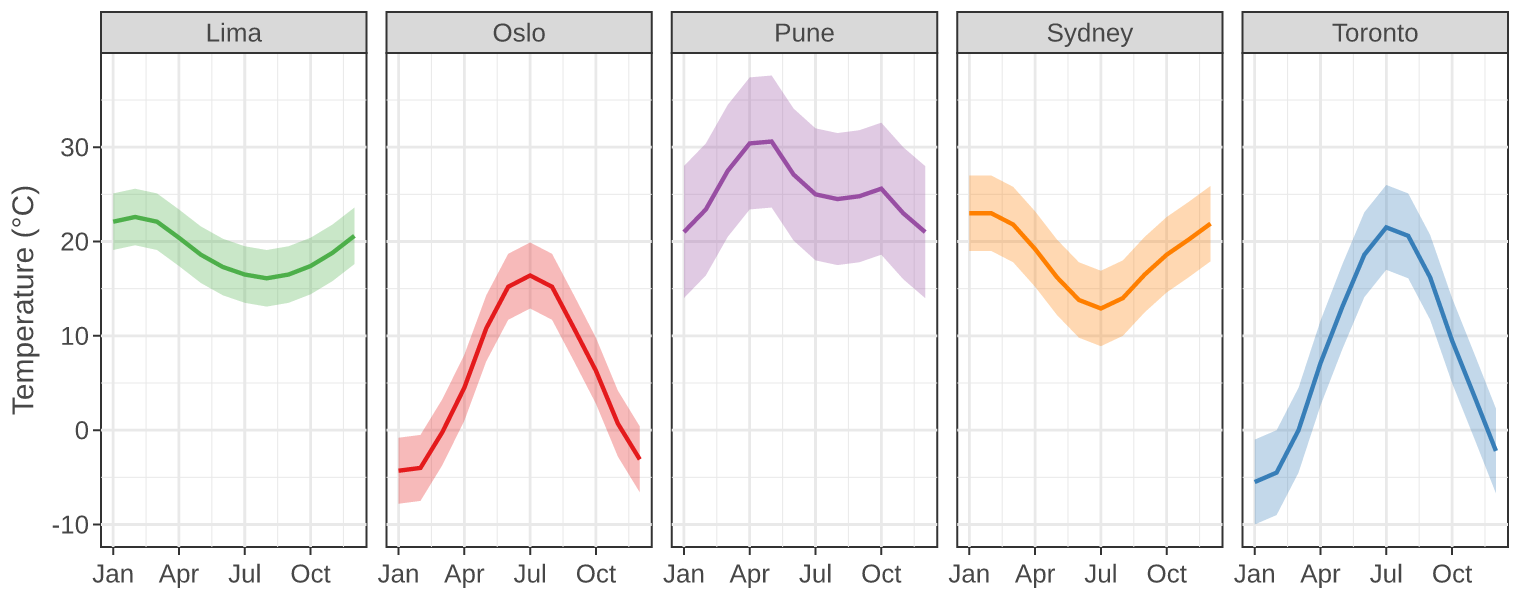
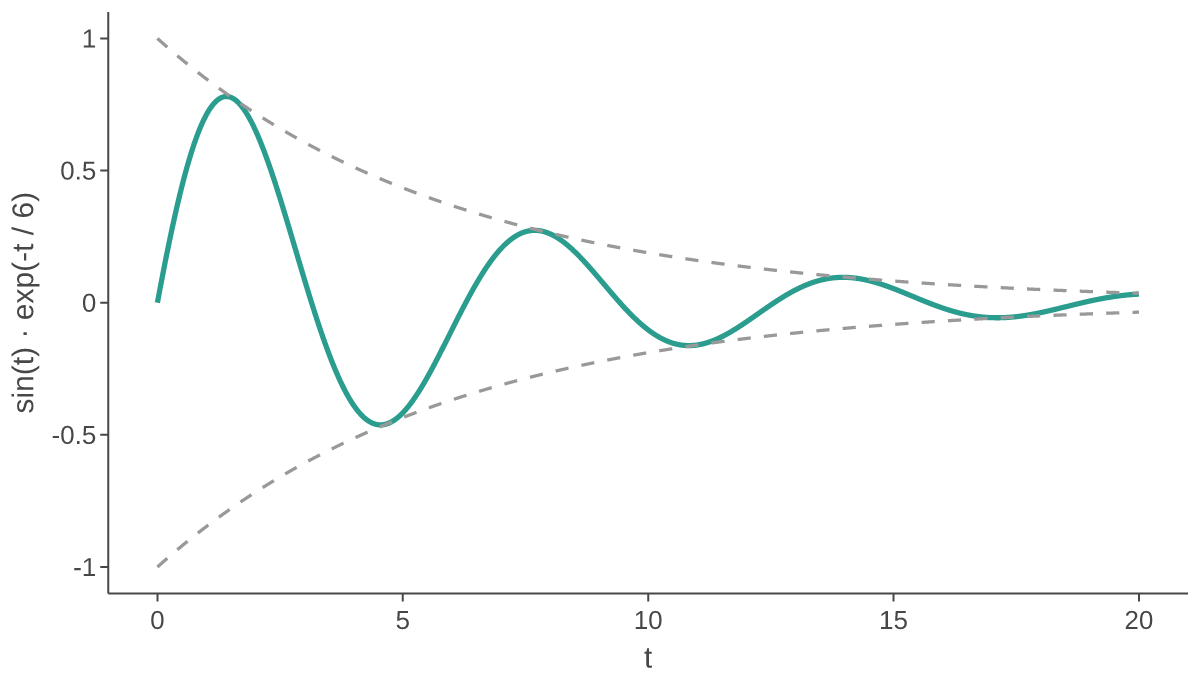
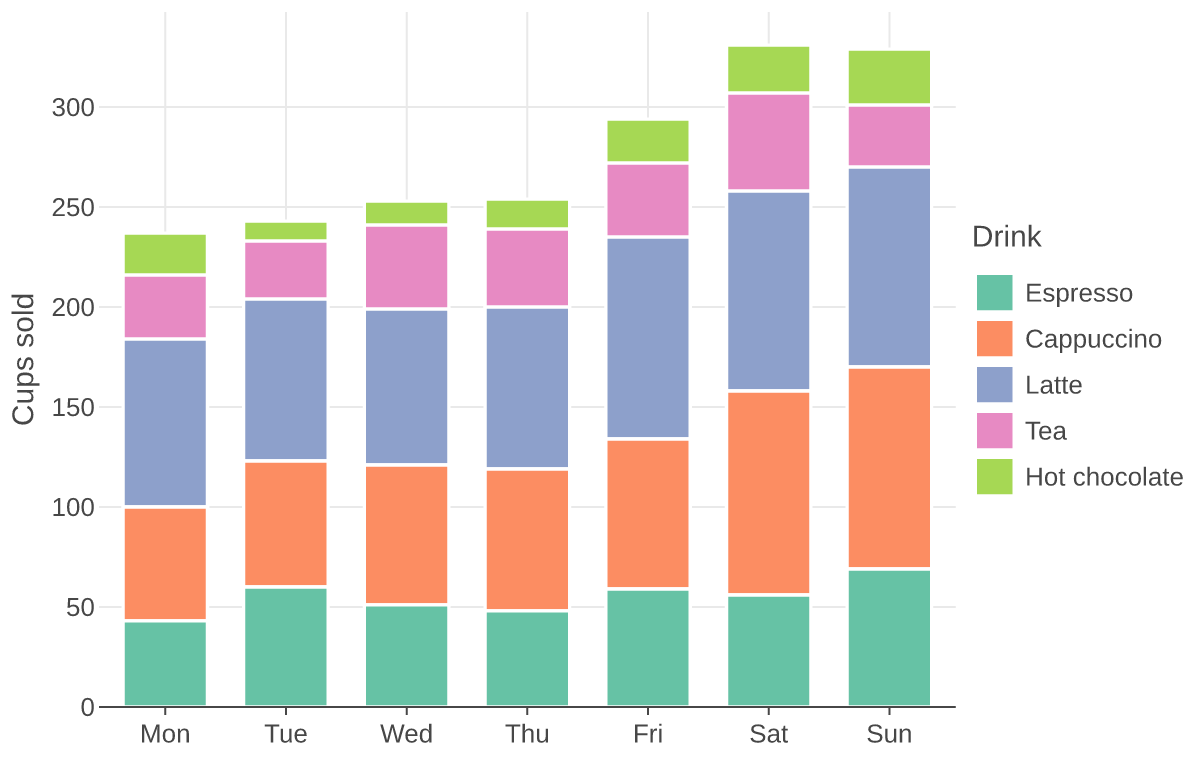
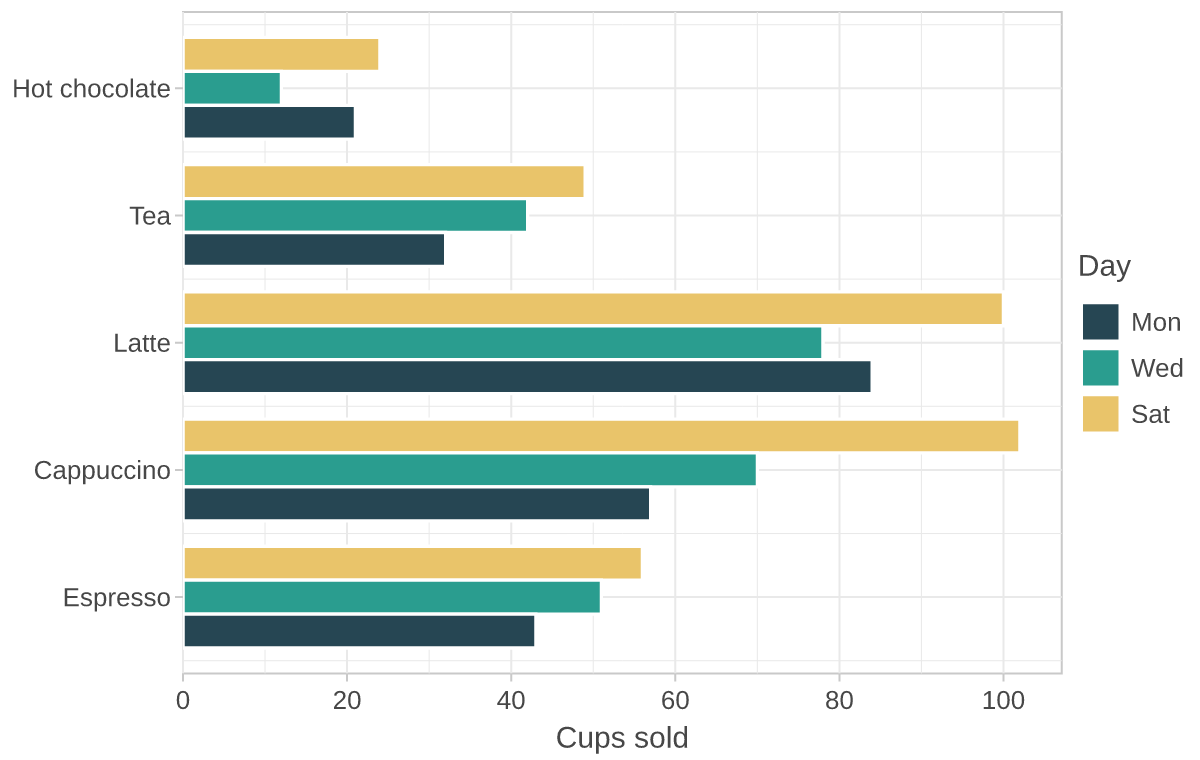
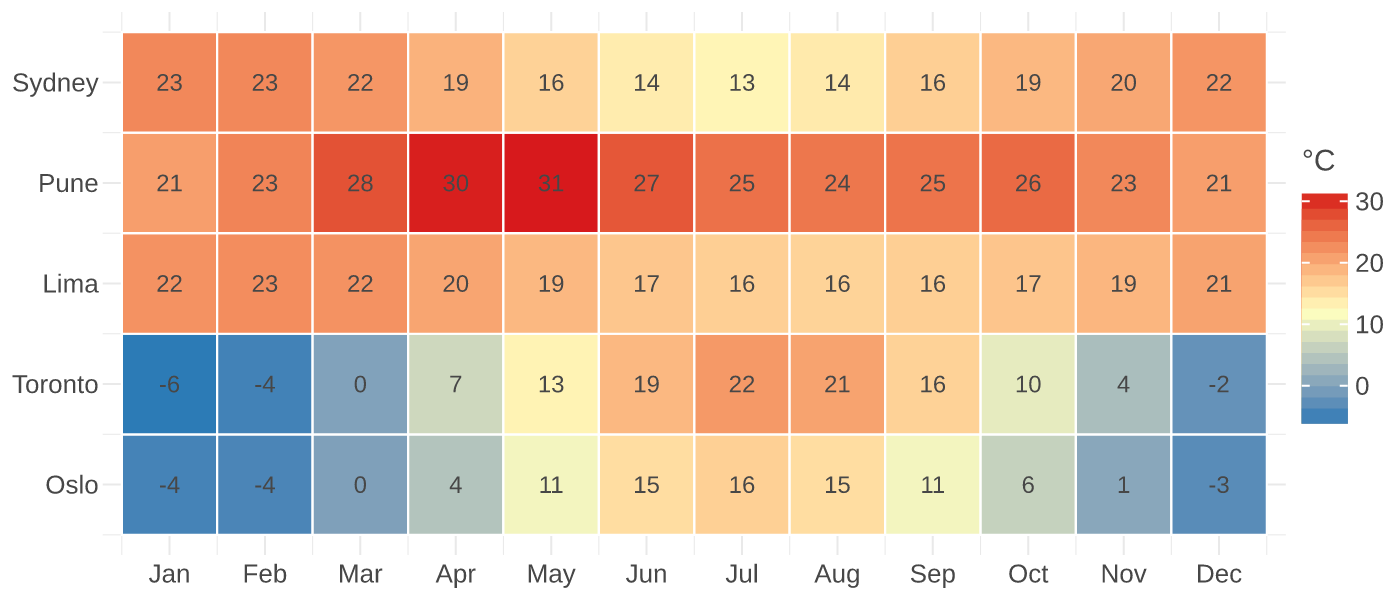
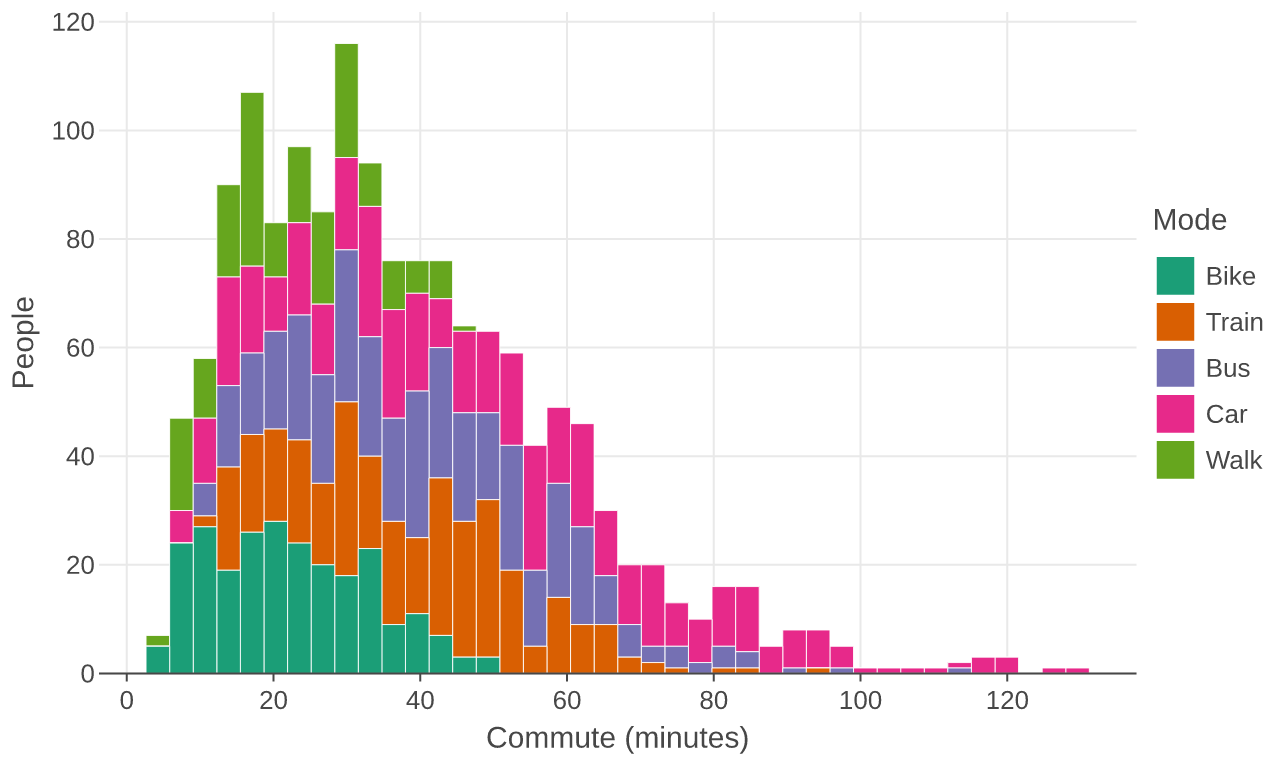
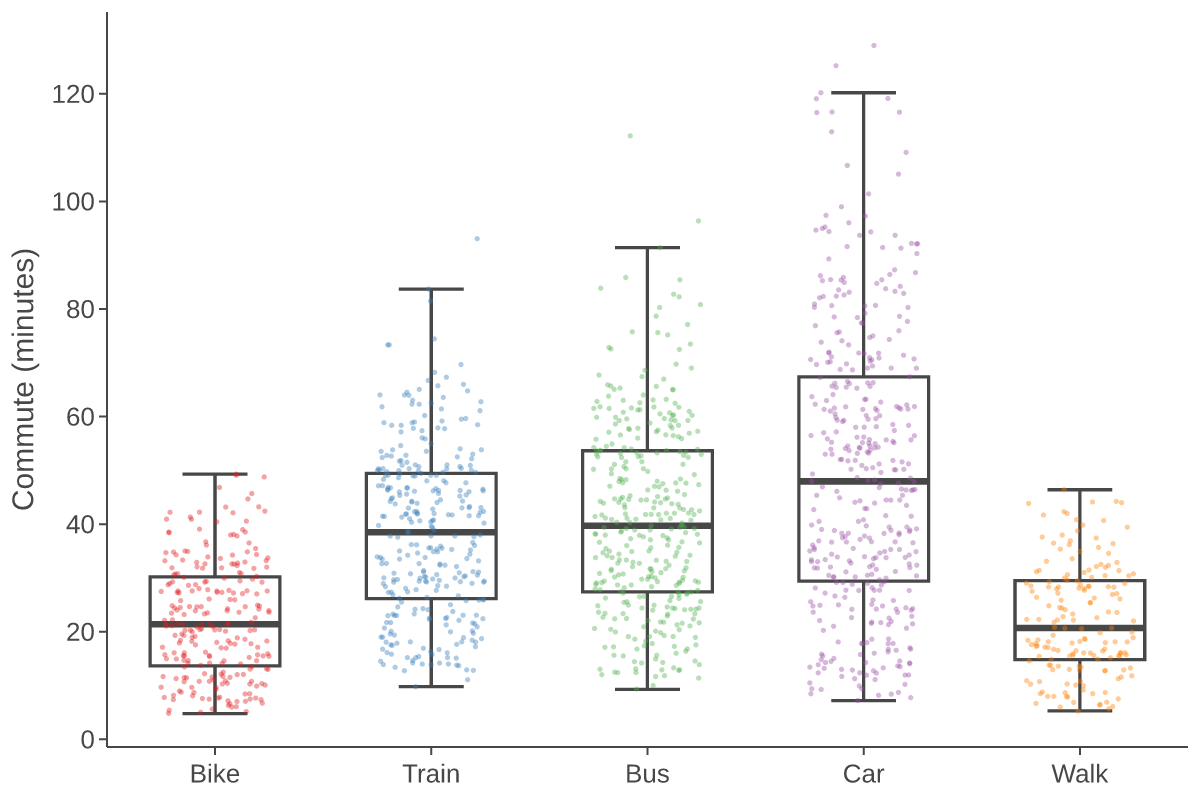
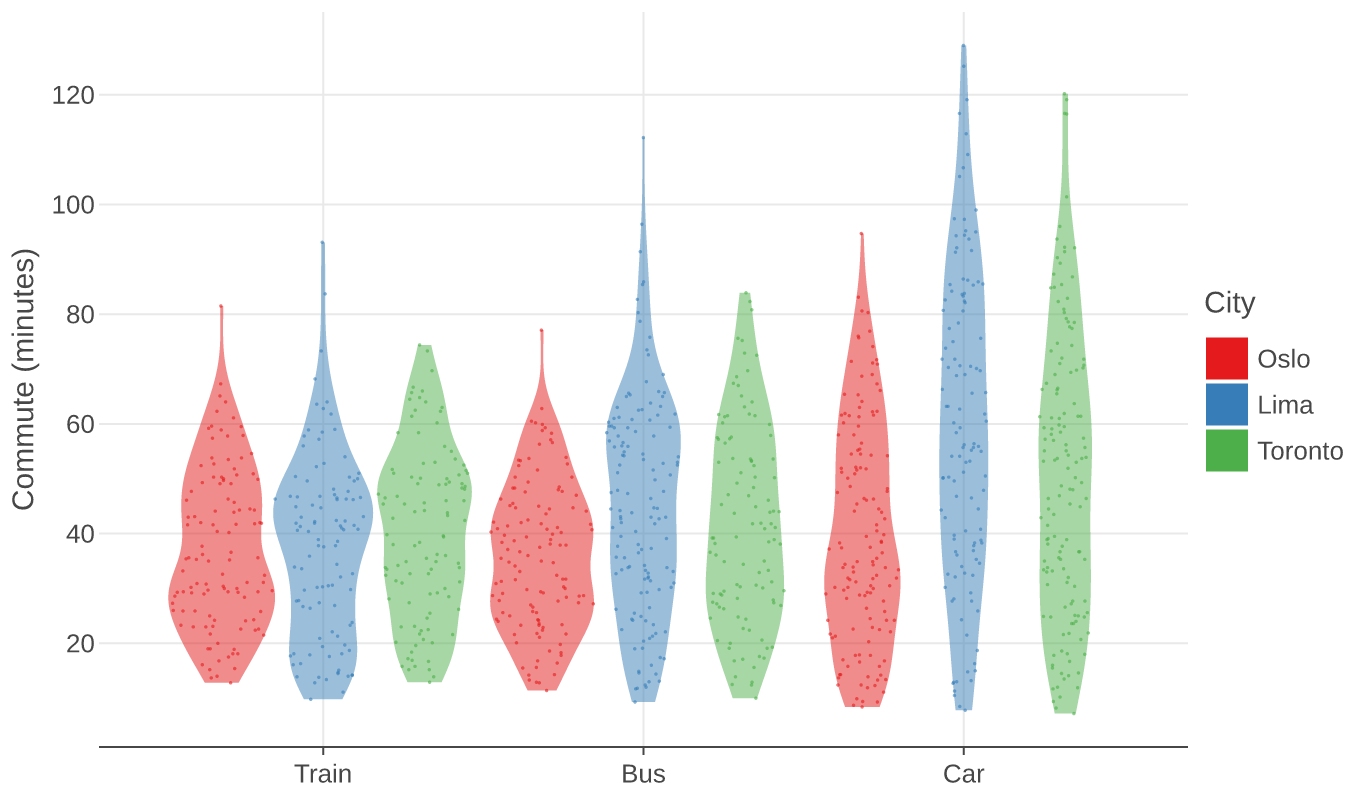
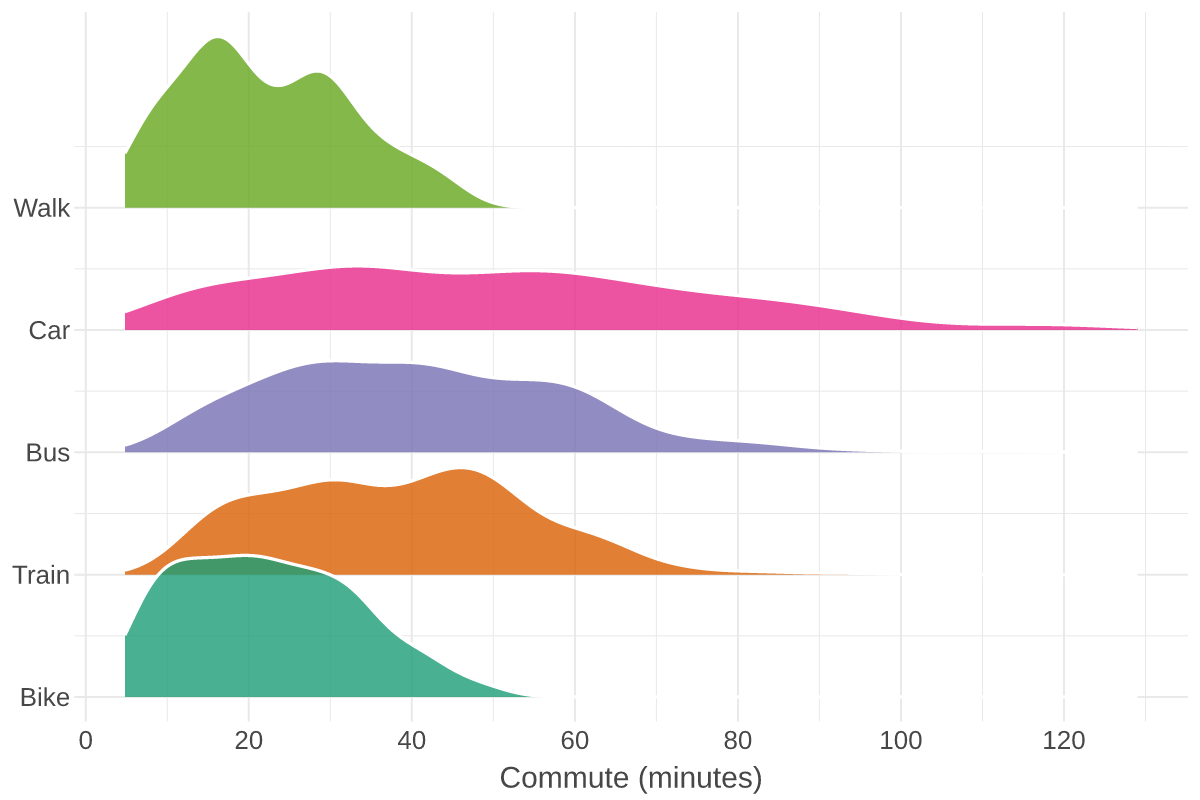
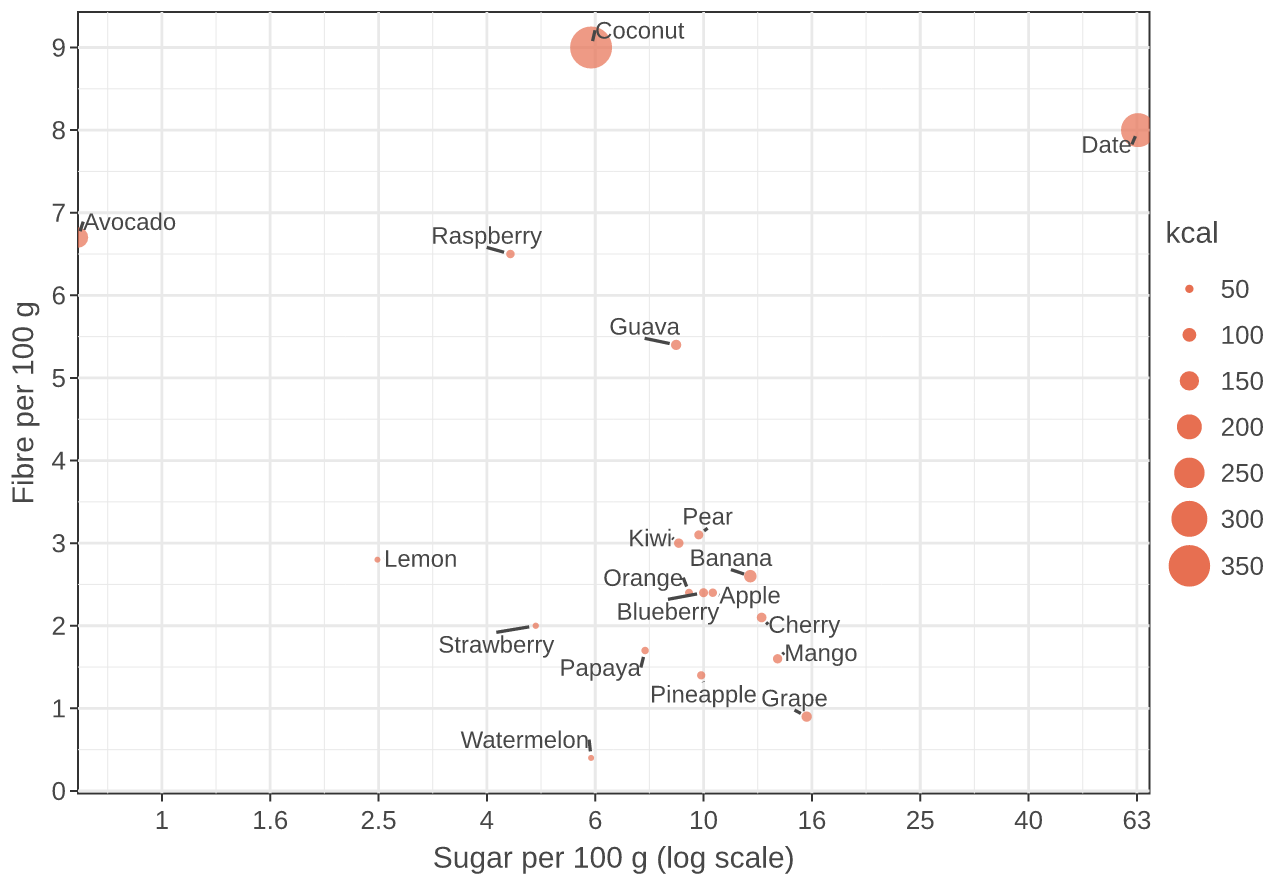
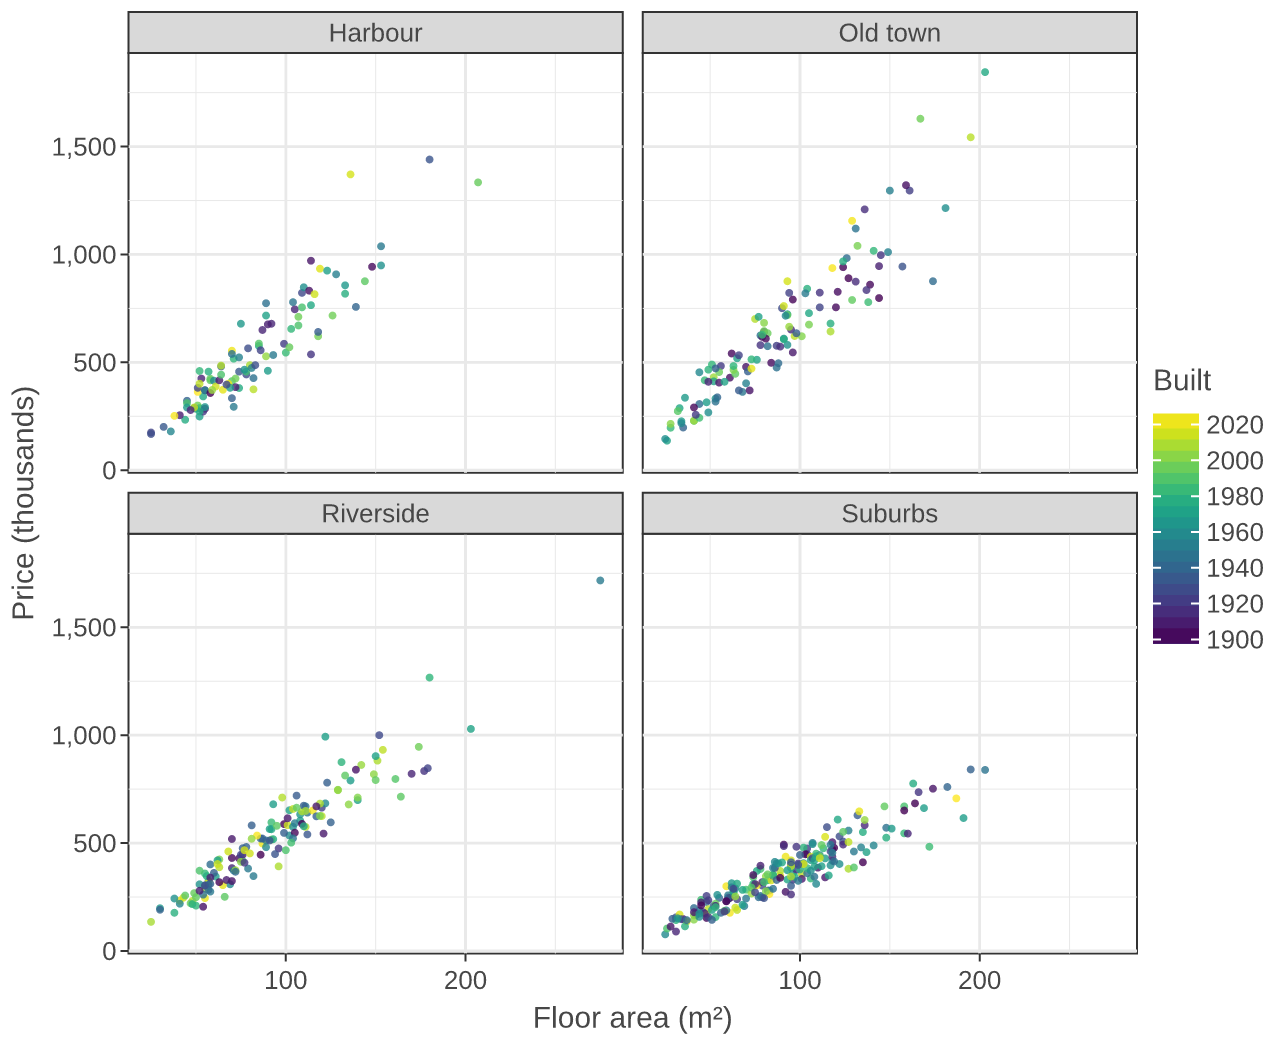
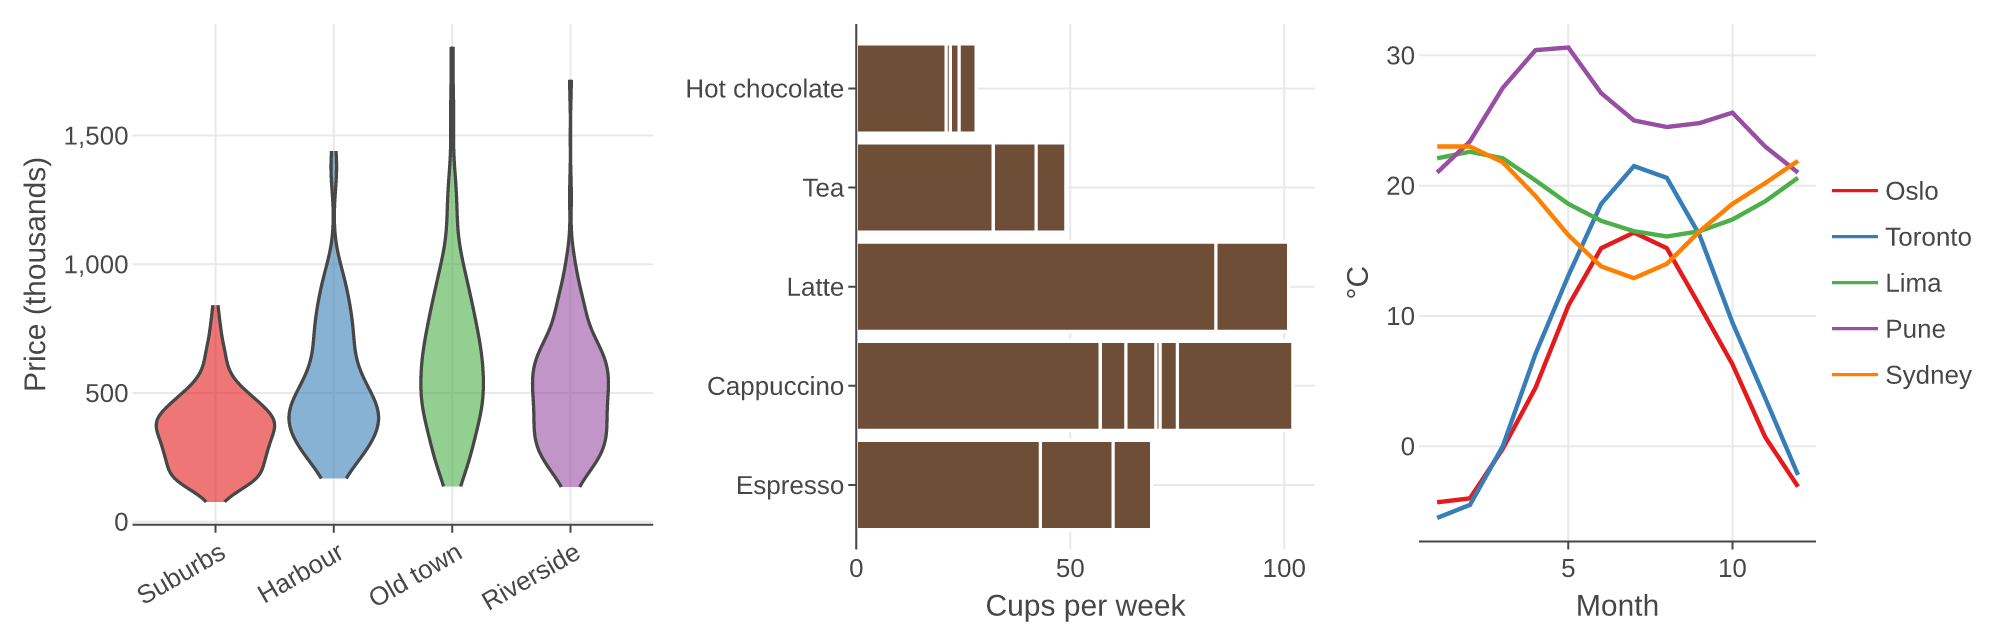
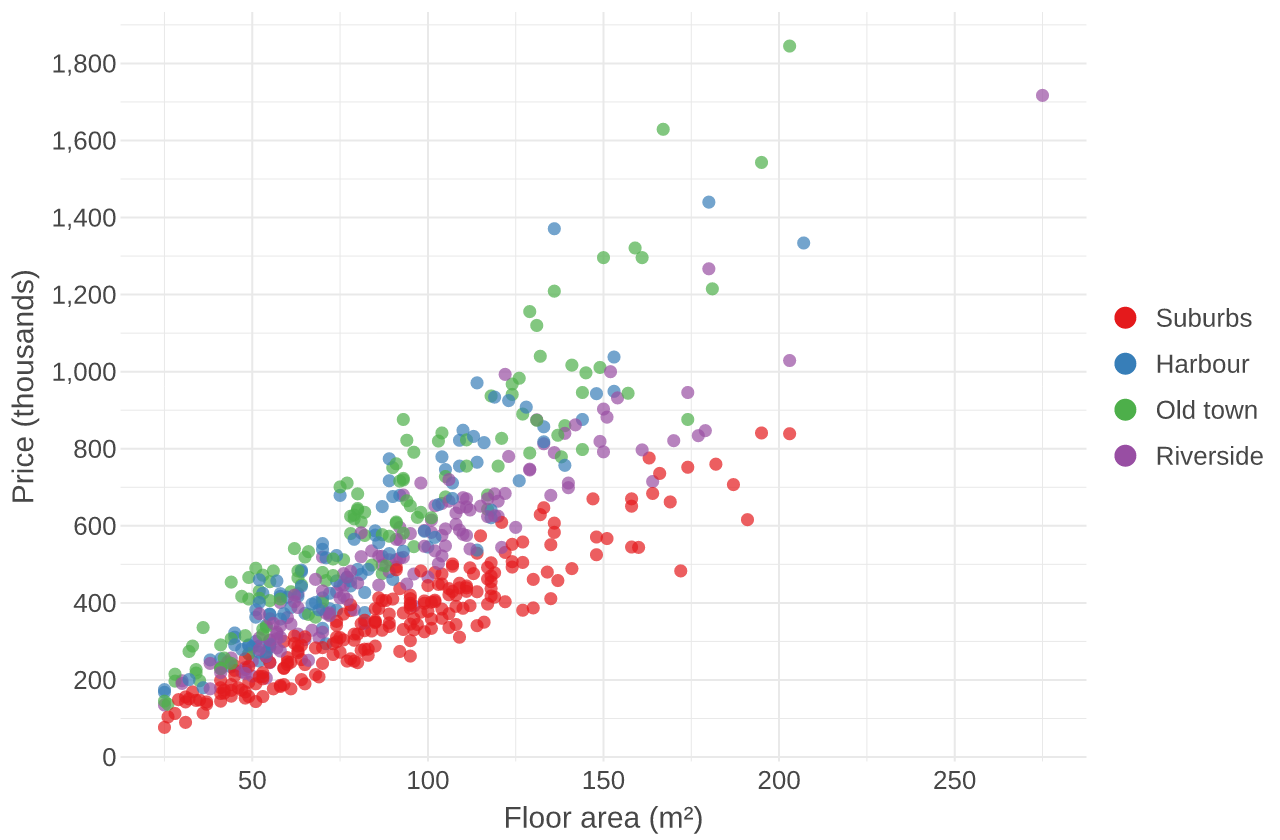
Gallery¶ Every plot here is rendered by ggrust from the code on its page. Open one to hover, zoom and pan, and copy the code: it reads small everyday datasets straight from GitHub, so it runs as is. Points and lines¶ Home prices by floor area Monthly temperatures Daily temperature range Plotting a function Bars and tiles¶ Cups sold per weekday Drinks side by side Temperature heatmap Distributions¶ Commute time histogram Boxplots with points Violins by city Ridgelines Labels, facets and grids¶ Labelled scatter Small multiples A small dashboard Interactivity¶ Custom tooltips One hundred thousand points